First Lab Report : "Ulam Raja"


  FACULTY OF SCIENCE AND NATURAL RESOURCES
SS11403 SAINS TANAH SEKITARAN
SEMESTER 2 2017/2018

       Date of Submission: 20th March 2018

 MRS. DIANA DEMIYAH BINTI MOHD HAMDAN

TITLE : 'ULAM RAJA'

NAME
IC NUMBER
MATRIC NUMBER
MOHD FATHULIZZAT BIN ASFI
970528125555
BS17110533
CHIN JIA HUI
970616125600
BS17110550
RINA BINTI SARIKA
981008125096
BS17110233
MAIZATUL AKMAR BINTI MOHAMAD NIZAM
970130235172
BS17110366
NORFARAH A'AINA BINTI BAHARIN
980118126298
BS17160676
NOOR HIQMAH BINTI MASBOL
980607015214
BS17110045


1.0 INTRODUCTION 

Soils are described as the skin of the earth , as it is the vital part of the environment. It provide land or area for plant to grow as well as give support for the growing crops, plants and trees not only in wild but on the farm and in our gardens. Soils are important as a home or habitat for millions of soil organisms and also the foundation for our buildings and roads. Due to this , it influences the distribution of plant ,animals and also human population.Other than living organisms, it also contribute to the natural environment, it controls the flow of water through the landscape and as a filter removing pollutant or dirt from water because most rainwater ends up moving into the soil before it gets absorb by plant roots. Soil affect the climate as organic matter in the soil is one of the major pools of carbon in the biosphere and it can drives climatic change and response variable to climate change. Soils also regulates other greenhouse gases such as nitrous oxide and methane. 

     There are numerous pores in the soil , when water flow in and absorbed by the soil, the excess water escape form the soil and remaining water will stay within the soil. The water contained in soil is known as soil moisture. As plant always absorb water from soil , therefore soil water become major component of the soil to plant growth. If the moisture content of a soil is suitable for plant growth, plants can readily absorb soil water which is mostly in thin film. Soil is important medium for supply nutrients to growing plants as these soil water dissolves salts.Other than that, moisture of soil play an importance role in control and allow the water and heat energy exchange process between the land and the atmosphere through evaporation and transpiration of plant. As a result, soil moisture is importance in the development of weather patterns as well as the production of precipitation. 

     Soil water holding capacity is the amount of water that a given soil can hold for crop use and it is very important agronomic characteristic. Soils that having high water holding capacity can hardly drain away the nutrients or soil applied pesticides. As the soils with a low water holding capacity reach the saturation point faster and sooner than soil with higher water holding capacity. The excess water and nutrients can be easily drained away from soil after saturated with water. 

     The soil texture and the organic content always affect the soil water holding capacity. Soil texture is a related to the particle size distribution of a soil. The larger the size of particle in the soil indicate lesser pore spaces and result lesser water can be store in the soil. Generally, the small particleshave a much larger surface area than the larger sand particles. This large surface area allows the soil to hold a greater quantity of water, therefore higher soil water holding capacity. 

     The acidity or basicity of soil is known as soil pH. Soil pH is considered a master variable in soils as it affects many chemical processes. Plant nutrient availability can be affected by controlling the chemical forms of the different nutrients. Most of the plants having a pH range in between 5.5 and 7.5. The soil can be categorize into two group which is the acidic soil and alkaline soil. Acidic soils can be commonly found in areas with abundant rainfall, nutrients dissolve slowly in acidic soils where for Alkaline soils, these is the soil which having pH level of over 7 and more common in the Western states that experience less rainfall. The pH of the soils also affect the growth of plants, as some of the plant or organisms that live in the soil like earthworm cannot survive if the soil either become more acidic or alkaline. 

     In conclusion, soil may looks still and lifeless, but this impression couldn’t be further from the truth as it is constantly changing and developing through time to time. Soil is always responding to changes in environmental factors, along with the influences of man and land use. 


2.0 OBJECTIVES

First and foremost, the main objective for this experiment is to determine the soil texture, colour of soil and soil moisture. Soil colours are most conveniently measured by comparison with a soil colour chart. Besides, it also has been found to be the property of soil that most reflects its pedogenic environment and history. Soil organic matter and iron oxides contribute most to colour soil. Organic matter darkness soil, while iron oxides produce a range of soil colours that are dependent on the oxidation state of the iron. For information, determination of soil colour is useful to characterize and differentiate soils. The colour of soil can be determine by using Munsell Soil Colour Charts which will be used to familiarize student with that and how to use it correctly. Colour determinations are applied to air-dried bulk soil samples; but more elaborate colour-determination schemes have also been advocated. Since colour is one of the most useful attributes to characterize and differentiate soils, its adequate determination has importance in many soil studies. 

     Next, determinations of soil moisture. Soil moisture is the key hydroecological compartment, responding dynamically to sequences of the complex processes in the soil. In this experiment, we determined the soil moisture by using Soil Moisture Sensor. For information, determination of soil moisture is important because soil water is the major component of the soil in relation to plant growth. If the moisture content of a soil is optimum for plant growth, plants can readily absorb soil water. Not all the water, held in soil is available to plants. Soil water dissolves salts and makes up the soil solution, which is important as medium for supply of nutrients to growing plants. 

     Lastly is the soil texture. The experiment held to determine the soil texture qualitatively by the ribbon method. As we know soil texture also one of the most important physical properties of soil. Soil texture is related to a number of important soil characteristics such as water holding capacity, soil drainage and soil fertility. Soil texture can be determined in a qualitative fashion or a quantitative fashion. A qualitative determination of texture gives us an estimate of texture. A quantitative determination of texture gives us a precise measurement. 

3.0 METHOD & MATERIAL

SOIL PHYSICAL PROPERTY: SOIL TEXTURE BY JAR TEST
  1. To work out what soil (about 60-70% volume of the jar) is made up, the jar was filled with soil. 
  2. Water was added almost filling the whole jar. 
  3. Jar lid was tightly closed. 
  4. The jar was vigorously shake about 10 minutes and let it settle out. 
  5. The sand and large particles fall to the bottom first. 
  6. Leave the jar undisturbed for 24 hours. 
  7. Mark the separate layers. 
  8. From the 3 marks on the jar we can work out the percentage of Sand to Silt to Clay by using the Soil Textural Triangle. 
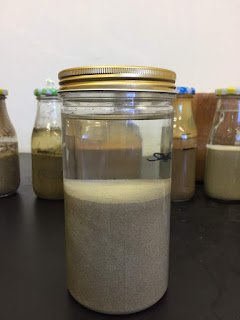

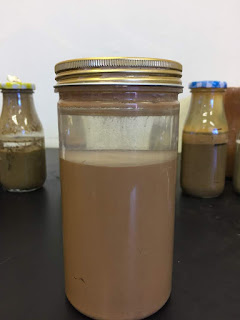
Figure 3.0.1 Sand Soil

Figure 3.0.2 Wetland Soil

Figure 3.0.3 Red Soil

Figure 3.0.4 Ground Soil

Figure 3.0.5 Hill Soil


SOIL PHYSICAL PROPERTY: SOIL TEXTURE BY FEEL 

  1. About 2 tablespoons of soil was takes in one hand and water was added , drop by drop while working the soil until it reached a sticky consistency . 
  2. The wetted soil was squeezed between thumb and forefinger to form a flat ribbon . 
  3. The texture can be determine based on the length of the ribbon that can be formed without breaking . 
Figure 3.0.6 Sand Soil


Figure 3.0.7 Red Soil


Figure 3.0.8 Hill Soil


Figure 3.0.9 Wetland Soil


Figure 3.0.10 Ground Soil

SOIL PH AND WATER HOLDING CAPACITY OF SOIL 

SOIL MOISTURE
  1. Before watering the plant, the soil moisture of the plant soil was checked using the portable soil moisture tool. 
  2. Then, the soil pH meter was used to check the soil pH. 
  3. Check the soil moisture that were air dry previous lab week. 
  4. If it was not completely dried out, put the soil sample in the oven and heat up at 80 degrees Celsius for about one hour and check again. 
  5. After soil is completely dried out, the dry soil was weighed. 

Figure 3.0.11 Process of determining the moisture of soil

SOIL PH 
  1. A few spoonful of soil into a jar/beaker was transferred and stir solution mixed with deionized water. 
  2. The solution was filtered into a folded filter paper place on a funnel sitting on a test tube. 
  3. The pH paper was used to test the pH of each soil solution. 
  4. The pH paper was dipped into the soil solution and take it out to dry for a while. *Note the colour and compare with the chart. 
  5. Photos of the result was taken. 
  6. The filter solution pH was checked using the soil pH meter in the lab. 
  7. 3 methods was used to check the soil sample pH. 

Figure 3.0.12 Process of determining the pH of soil

SOIL WATER HOLDING CAPACITY 
  1. A filter paper was taken and place it at the bottom of the tin box. 
  2. The tin was weighed along with the filter paper. 
  3. Some soil was taken and transferred into the tin box. (Make sure all sample soil tested have the same amount of volume. 
  4. All soil sample was tested. If only one soil sample type it was done two times. 
  5. The soil was pressed gently as compact as possible until a uniform layer on top. 
  6. The tin box was weighed with soil and its weight was noted. 
  7. A water was poured into a weight plastic container and two small plastic rod was placed to support the tin box float in contact with water. 
  8. The tin box was left undisturbed until water surface on top of the soil and soil is moist. 
  9. The tin box was lifted and dripping water was wiped from the tin box bottom before measure the weight. 

4.0 RESULT AND OBSERVATION

5 March 2018

SOIL PHYSICAL PROPERTY: SOIL TEXTURE BY JAR TEST
RESULT:
Soil sample
Soil height (cm)
Water (cm)
Organic matter (cm)
Unknown (cm)
Sand
7
5
-
-
Red soil
9.2
2.7
1.4
-
Hill soil
10
0.3
2.6
-
Wetland
8
2.1
0.4
0.3
Ground soil
10.5
2.5
0.5
-


SOIL PHYSICAL PROPERTY: SOIL TEXTURE BY FEEL

* Guideline 
Soil texture
Length of ribbon
Types of sandy loam
≤ 2.5 cm
Types of silt  loam
2.5 – 5 cm
Types of silt clay
≥ 5 cm


RESULT:
Soil sample
Length of ribbon (cm)
Soil texture
Hill soil
5
Sandy loam
Red soil
3.8
Silt  loam
Ground soil
3.4
Silt  loam
Wetland
3.6
Silt  loam
Sand
2.1
Silt clay


SOIL PHYSICAL PROPERTIES TEST : SOIL COLOR

MUNSELL COLOR CHART:
Soil sample
Hue (Yellow – Red)
Value
Chroma
Hill soil
2.5 YR
2.5
1
Red soil
10 YR
5
6
Ground soil
10 YR
2
1
Wetland
2.5 YR
4
4
Sand
2.5 YR
6
3


Soil sample
Weight before a week (g)
Weight after a week (g)
Hill soil
100
87.0102
Red soil
100
92.3378
Ground soil
100
71. 0491
Wetland
100
90.7476
Sand
100
80.8647


12 March 2018

SOIL PH AND WATER HOLDING CAPACITY OF SOIL

RESULT:
Soil sample
pH
pH meter
pH paper
Moisture
Ground soil
6.78
5.52
5
3.5
Wetland
6.70
6.28
5
1.4
Red soil
6.80
4.62
4
2.5
Hill Soil
6.40
6.27
5
5.5
Sand
6.20
5.93
6
5.1


SOIL WATER HOLDING CAPACITY

RESULT: 
Soil Sample
Weight of Tin
Weight tin + Filter paper (A)
Weight tin + Filter paper + soil sample (B)
Weight tin + Filter paper + wet soil (D)
Weight dry soil
B – A = C
Weight wet soil
D – A = E
Mass water absorb by soil
E – C = N
% of water holding capacity
Hill soil
9.2654
9.8218
90.0982
139.5442
80.2764
129.7224
49.446
38.12 %
Red soil
8.9680
9.5226
95.2517
127.1089
85.7291
117.5863
31.8572
27.09 %
Ground soil
9.4315
9.9899
74.1234
132.4908
64.1335
122.5009
58.3674
47.65%
Wetland
9.4318
9.68805
94.0360
137.1569
84.1555
127.2764
43.1209
33.88%
Sand
9.5189
10.0856
83.7075
113.9425
73.6219
103.8569
30.2350
29.11 %

We can calculated the percentage of water capacity by using this formula :

N/E X 100

N = Mass water absorb by soil
E = Weight of wet soil
          

5.0 DISCUSSION

SOIL MOISTURE
Soil moisture is the water that is held in the spaces between soil particles. Moisture content is the quality of water contained in a material such as soil, rock, ceramics, crops or wood. Water content used in a wide range of scientific and technical areas. The volume of soil moisture is small; nonetheless, it is fundamental importance to many hydrological, biological and biogeochemical processes. Soil moisture information is valuable to a wide range because it concerned with weather, climate, runoff potential, flood control, soil erosion, slope failure, reservoir management, geotechnical engineering and water quality. Soil moisture is a key variable in controlling the exchange of water and heat energy between the land surface and the atmosphere through evaporation and plant transpiration. 

     All five types of soil from Outdoor Development Centre, UMS Peak, Bukit Kokol, lake at Faculty of Science and Natural Resources and Excellent Residential Collage are all weighted 100g and left the soils at five different plastic plates where it has large surface area for one week duration. After one week, the soils are weight again and record the different. The different weight of soil before and after one week shows the how much water content in the soil that has been lost through evaporation. The water content of in soil is 12.9898g, red soil is 7.6622g, ground soil is 28.9509g, wetland soil is 9.2524g and sand soil is 19.1353g. 

   From the experiment, the red soil shows the lowest water content among the five types of soil because red soil is low water holding capacity. Red soil is a type of soil that develops in a warm, temperate, moist climate under deciduous or mixed forest as it having thin organic-mineral layers overlying a yellowish-brown leached layer resting on an alluvial red layer. As the red soils are generally derived from crystalline rock.The soil that has most water content is ground soil which it has high water holding capacity. The ground soil is usually can be found in terrestrial forest where the water is absorbed on the Earth. As the ground water also rich with nutrient and well-drained spaces. 

    Soil moisture measurements in agricultural settings provide important information for drought early warning. The upper 200 centimetres of soils is classified as the “root zone soil moisture” and is important for describing the water that is available to plants. When drought occurs, there is a deficit amount of moisture in the root zone, and consequently crop productivity diminishes. Having continuous soil moisture measurements will lead to improved crop yield forecasting, and irrigation planning.

    Soil moisture measurements also are important for predicting floods. By assessing how wet the soil is before a rainstorm, we can predict the potential for flooding to occur. If the soil is already oversaturated, at its maximum water-holding capacity, a rain event will not be absorbed adequately through the soil and flooding will likely occur.

   Currently, weather prediction relies more heavily on observing the moisture levels in the atmosphere, instead of observing the moisture levels of soils; yet this is mostly due to the lack of soil moisture data available. Having soil moisture measurements may provide for a more accurate weather forecast. For example, soil moisture measurements could provide meteorologists with information on the amount of water available to evaporate from the land surfaces, which are directly related to weather and climate forecasting.

     Soil moisture links together the water, energy, and carbon exchanges between the land and the atmosphere. Observing soil moisture measurements allows for an assessment of the entire Earth system, and analysing global changes is extremely important for understanding future climate change impacts.


SOIL COLOR

The Munsell notation is used to supplement the colour names wherever greater precision is needed, as a convenient abbreviation in field description. For the expression of the specific relation between colours and for statistical treatment of colour data. The names for soil colours are common terms now defined as to obtain uniformly and yet accord as nearly as possible with past usage by soil scientists. The Munsell colour notation for colour consists of separate notations for hue, value and chroma which are combined in that order to form the colour designation. 

     The symbol for hue is the letter abbreviation of the colour of the rainbow which R for red, YR for Yellow-Red, and Y for yellow, proceeded by numbers from 0 to 10. Within each letter range, the hue becomes more yellow and less red as the numbers increases. The middle of the letter range is 5; the zero point coincides with the 10 point of next redder hue.

     The notation for the value consists of numbers from 0 for absolute black to 10 for absolute white. Thus colour of value 5/ is visually midway between absolute white and absolute black. The notation for chroma consists of numbers beginning at 0 for neutral greys and increasing at equal intervals to a maximum of about 20 which is never really approached in soil. For absolute achromatic colours such as pure greys, white and black, which have zero chroma and no hue, the letter N stands for neutral takes the place of a hue designation. 

     In writing the Munsell notation, the order that need to follow is hue, value, chroma with a space between the hue letter and the succeeding value number and a diagonal between the two numbers for value and chroma. If expression beyond the whole numbers is desired, decimals are always used, never used fractions to determine the hue, value and chroma. The notation in decimal are shows the capability of expressing any degree of refinement desired. Since colour determinations cannot be made precisely in the field-generally no closer than half interval between colours in the chart-expression of colour should ordinarily be to the nearest colour-chip. 

    In using colour charts, accurate comparison is obtained by holding the soil sample directly behind the apertures separating the closest matching colour chips. The colour of sample be perfectly matched by any colour chart are rarely to be happened. 

     Since the five different types of soils are took from different types of places, the soil colour from Munsell colour chart also different. The dry soil needed to put at palm and put a few drops of water to let the soil becomes a little bit wet to determine the colour of soil. The hill soil from UMS Peak shows the 2.5YR 2.5/1 on Munsell colour chart that means the colour of hill soil is light brown but darker and look more grey. The red soil from Excellent Residential Collage shows 10YR 5/6 on Munsell colour chart means the soil colour is reddish, midway between absolute white and absolute black. The ground soil from Bukit Kokol shows 10YR 2/1 means that the soil colour is darker brown, likely nearer to absolute black and pure grey. The wetland soil from lake at Faculty of Science and Natural Resources shows the 2.5YR 4/4 meaning that the soil colour is slightly more light brownish, slightly to absolute black but also slightly to pure grey. Lastly, the sandy soil from Outdoor Development Centre shows the notation 2.5YR 6/3 on Munsell colour chart shows that the colour of sandy soil is light brown, slightly too absolute white and slightly to pure grey. 

     As the soils are widely different from a location to another, soil colour depends on organic matter and minerals content and is influenced by drainage. Colour is one of the most obvious characteristics of soil. Colour can also provide a valuable insight into the soil environment and hence is very important in assessment and classification. The most influential colours in a well-drained soil are white, red, brown and black. Soil colour darkens as the oil changes from dry to moist. But longer term changes are linked to water relations as well. Careful observation of colour changes is linked to water relations as well. Observation of colour can help identify problems of waterlogging or leaching. Poorly drained soils are often dominated by blue-grey colours often with yellow mottling. Well drained soils will usually have bright and uniform colours. 

     The top soil is usually darker than lower layers because this is where organic matter accumulates. The soil colour provides clues about the content of organic matter contains is certain areas. The present of organic matter, soil minerals and drainage conditions of soil all influence the soil colour. The final stage of organic matter breakdown is black. Throughout the stages of organic matter breakdown, the colour imparted to the soil varies from brown to black. Sodium content influences the depth of colour of organic matter and therefore the soil. Sodium causes the organic matter to disperse more readily and spread over the soil particles, making the soil look darker.

     Light or pale colours in grainy topsoil such as sandy soil are frequently associated with low organic matter content, high sand content and excessive leaching. The darker soil colours such as hill soil, ground soil and wetland soil may results from poor drainage or high organic matter content. While when the soils contain shades of red, for example is red soil, indicate a clay soil is well-aerated. Soil colour also usually due to several pigments contains in the soil. The ground soil is a black colour soil that may come from organic matter, while sandy soil is white soil that may come from silicates and salt. The red soil, hill soil and wetland soil are more reddish in colour shows that the soil is from iron and aluminium oxides.

     The colour of soil also classifies the mineral matter that derived from the constituents of parent material. The rocks are broken down from soils and sometimes these rocks given their colour to the soil. More usually the colour of the soil results from compounds such as iron. Besides, the red, yellow, grey and bluish-grey colours result from iron in various forms. Under average conditions of air and moisture. The iron forms a yellow oxide imparting a red colour to the soil. Yet in waterlogged soil, with a lack of air, iron forms a reduced state giving the soil either grey or green, bluish-grey colours.

     Soil colour is a study of various chemical processes acting on soil. These processes include the weathering of geologic material, the chemistry of oxidation-reduction actions upon the various minerals of soil, especially iron and manganese and the biochemistry of the decomposition of organic matter. Other aspects of Earth science such as climate, physical geography and geology all influence the rates and conditions under which these chemical reactions occur. 


SOIL TEXTURE 

The texture of soil can be determined by jar test, ball test and ribbon test. All of these tests are done in the laboratory. The texture of soil are refers to the particles size of soil. A Mason jar soil test can be performed with a 1-quart jar and a tight fitting lid. The different jar needed for different soil. For the reading of Mason jar test is, the heaviest material including gravel or coarse sand will sink to the very bottom with smaller sand on top of that. Above the sand, there are silt particles with clay at the very top of the jar followed by murky water and organic matter. 

     The sandy soil that took from Outdoor Development Centre shows the properties of sandy particles sinking and forming a layer on the bottom of the jar. The water will also appear fairly clear. Sandy soil drains quickly but do not hold nutrients well. The sand soil holds only two layers which are sand particles with clear water above it. 

     The red soil, hill soil and ground soil shows only three layers are forming through the experiment which are categorized as the soil, water and organic matter. Errors are found through the result of this experiment. The layer that should be form for all these three types of soil are either four or five layer because from the ribbon experiment, the hill soil shows the properties of clay soil while red soil and ground soil show the properties of slit loam soil. The error could be occurred because the division of layer form are not vividly clear. There is also some soil sticking at the wall of the jar cause the reading of layer form becomes an error. Even though after putted a few spoon of detergent to remove the sticking soil, the layer of soil form still cannot be seen clearly due to some error. 

       Meanwhile, the wetland shows the four layer form in the jar test which are categorized with sand soil, silt soil, water and organic matter. The wetland soil is peaty soil as a few debris are floating on the surface with a small amount of sediment on the bottom and the soil is pea-like. The water also cloudy but does not as murky as clay soil. The soil is very organic but it is not nutrient rich and is prone to water logging. 

      Texture class of soil is the first important things that need to classify when a soil is examined. As it is related to weathering and parent material. The differences in horizons may be due to differences in texture of their respective parent materials. Texture class can be determined fairly well in the field by feeling the sand particles and estimating sit and clay content by flexibility and stickiness. There is no field mechanical-analysis procedure that is as accurate as the fingers of an experienced scientist, especially if standard samples are available. A person must be familiar with the composition of the local soils. This is because certain characteristics of soils can create incorrect results if the person does not take these characteristics into account. 

     The experiment shows the length of sand ribbon is 2.1 cm and forms a ball when it’s clumped together after its being wet with a few drops of water shows the sandy soil from Outdoor Development Centre of UMS is a sandy loam. The clods of sandy loam is not only easily broken when dry, also the sand can be seen and felt. After put a few drops of water, the sand becomes moist and its moderately grotty, forms a ball that can stand careful handling and definitely stains a finger when handlings the sandy loam. The sandy loam contains 43-85% of sand, 0-50% of silt and 0-20% of clay. 

     The sand iscomprised of quartz and resistant primary minerals such as mica. Sand particles are between 2mm and 20 microns in size. Sand is the largest of the mineral particles. Sand particles create large pore spaces that improve aeration and be able to tolerate on droughty conditions. Water flows through the large pore spaces quickly. Soils with a high percentage of sand are generally well drained meaning that sandy soil contains air that is similar to atmospheric air, which is conducive to healthy root growth and thus a healthy crop. Sandy soils lack the ability to hold nutrients and are not fertile. Sandy soils also feel gritty to the touch. Examples of plants are well-adapted to sandy soil are Blanket flower, Adam’s Needle, Wormwood, Aster, Echinacea and Carrot. 

     The soil that took from Excellent Residential College, Bukit Kokol and lake at Faculty of Science and Natural Resources are the red soil, hill soil and wetland soil. All of three soils show a characteristic of silt loam soil. The silty loam soil forms a weak ribbon when wet which are 3.8 cm, 3.4 cm and 3.6 cm. When the soils dry, the clods of soils are difficult to reach, when it’s pulverized, its feel smooth, soft and floury. After a few drops of water, the soils become moist and form a ball. The soils has smooth or slick surface, buttery feel and have a stains finger when it had been pushed. The soils contain 0-50% of sand, 50-88% of slit and 0-27% of clay. 

     Silt is the mid-size soil particle. Silts are typically composed of quartz and small mineral particles such as feldspars and mica. The size is between 2 microns and 20 microns in diameter. Silt has good water-holding ability and good fertility characteristics. It feels like flour when dry and smooth like velvet when moist. Silt soils are the most suitable soil for the plant growth. Silty soil is powdery with high fertility. Unfortunately soils that are high in silt can become waterlogged very easily. Examples of plants are well-adapted to silty soil are Swamp milkweed, Yellow iris and Japanese iris. 

      Based on experiment shows the hill soil from UMS Peak shows a few characteristics of clay form texture. The clay soil forms a flexible ribbon which is 5cm. The clods of soil cannot be broken with fingers without extreme pressure when it dries. After a few drops of water, the soils become moisture and form a ball. Clay forms hard clumps when dry and is sticky when wet. The soils also become quite plastic, usually sticky when wet and gives out a stain fingers. It’s a silty clay form as it feels very smooth. The silt clay soil contain of 0-45% sand, 0-40% silt and 40-100% clay. 

     Clays are made of secondary clay minerals and oxides or oxyhydroxides of iron and aluminium. Clay is the smallest size soil particle with the size is less than 2 microns in diameter. Clay has the ability to hold both nutrients and water that can be used by plants. It creates very small pore spaces, resulting in poor aeration and poor water drainage. The clay soil has the ability to tolerate long periods of excessive moisture with low oxygen conditions or to endure dry or hard soil. On top of that, the soil can remain wet for a long time of period. Examples of plants are well-adapted to clay soil are Aster, Bee Balm, Butterfly weed, Black-eyed Susan, Goldenrod, Hollyhock and Geranium. 

     The soil dictates the kind of plants that you can grow and has a huge bearing on how well he plants will grow. As the soil texture directly influence the moisture holding capacity, the drainage rate and the soils ability to hold nutrients, so it’s a proof that the soil texture are important to identify the suitable soil the plant growth. The soil texture are very firm and difficult to change, if a farmer need to improve the soil texture for the plant growth healthily, the farmer need to add up some different types of soil to increase the effectiveness of soil texture function but still it will not affect the soil texture. 


6.0 CONCLUSION 

In conclusion of this observation, soil moisture is the water that is held in the spaces between soil particles. The observation shows that the soils will having a bit difference weight due to water loss via evaporation. In fact,the lowest water holding capacity indicate the lowest water contain of the soil. Based on soil moisture measurement, the upper 200 centimeters of soils is classified as the “root zone soil moisture” and is important for describing the water that is available to plants. Based on the soil moisture, we also can predict the flood to occur and it is directly related to weather and climate forecasting. Soil texture is a related to the particle size distribution of a soil. The larger the size of particle in the soil indicate lesser pore spaces and result lesser water can be store in the soil. 

     There are some errors during the experiment to observed the soil texture which is, the jar is not shake vigorously enough. It makes some of different soil is still stick in the jar and not mix well. To manage the problem, we shake the jar again in 10 minutes with adding some of detergent and adding some water. Based on the result, some of the soil cannot predict its organic matter and uknown matter due to the error. Hand analysis is a simple and effective means to rapidly assess and classify a soil's physical condition. Correctly executed, the procedure allows for rapid and frequent assessment of soil characteristics with little or no equipment. The Munsell notation is used to supplement the colour names. From hue, value to chroma is the order to read and know the colors name specifically. Soil colour depends on organic matter and minerals content and is influenced by drainage and the changes of soil is link to water relations as well. Mostly, the lower organic matter, the lighter colour of the soil. Therefore, the topsoil is usually darker than lower layers because this is where organic matter accumulates.


REFERENCES 

1. James E. A., Charles L., Diame S. 1999. Soil moisture. Retrieve from https://weather.msfc.nasa.gov/landprocess/

2. Liza B. 2015. Why we should start thinking about soil moisture. Retrieve from https://earthzine.org/2015/02/03/why-should-we-think-about-soil-moisture/

3. Lynn W.C and Pearson M.J. 2000.The colour of soil, The Science Teacher. Retrieved from http://www.envirothonpa.org/documents/munsellcharts.pdf

4. Department of primary industries. Practical note: Soil colour. Retrieved on March 18 from http://vro.agriculture.vic.gov.au/dpi/vro/vrosite.nsf/pages/soilhealth_prac_soil_colour_pdf/$FILE/PracNote_Colour.pdf

5. Christina C. 2011. Why is soil water holding capacity important? Retrieve from http://msue.anr.msu.edu/news/why_is_soil_water_holding_capacity_important

6. Department of primary industries. Practical note: Soil colour. Retrieved on March 18 from http://vro.agriculture.vic.gov.au/dpi/vro/vrosite.nsf/pages/soilhealth_prac_soil_colour_pdf/$FILE/PracNote_Colour.pdf

7. James E. A., Charles L., Diame S. 1999. Soil moisture. Retrieve from https://weather.msfc.nasa.gov/landprocess/

8. Liza B. 2015. Why we should start thinking about soil moisture. Retrieve from https://earthzine.org/2015/02/03/why-should-we-think-about-soil-moisture/

9. Lynn W.C and Pearson M.J. 2000. The colour of soil, The Science Teacher. Retrieved from http://www.envirothonpa.org/documents/munsellcharts.pdf
10. Richard J. 2002.The Meaning and Importance of Soil pH. Retrieve from : https://hortnews.extension.iastate.edu/2002/5-24-2002/soilph.html
11. Ron Goldy. 2011.Understanding soil pH Part I.Retrieve from: http://msue.anr.msu.edu/news/understanding_soil_ph_part_i

12. Housenbuiler R. L., 1972. Principals and practices.Dubuque,lowa : WM. C. Brown Company Publishers.

13. Soil Science Society of America’s comprehensive website has a wealth of resources lessons and links retrieve from https://www.soils.org/lessons/resources/

14. Katharine B. and Andrew W. Retrieved on March 2018 from http://soilquality.org.au/factsheets/soil-texture-measuring-in-the-lab

15. Martin. Retrived on March 2018 from http://gardeningstepbystep.com/soil-texture/


Comments

Popular posts from this blog

First Lab Report: Cotton

Lab Report 2 : Sengkuang

First Lab Report: JAGUNG PANDAN (Analysis of Soil Colour and Soil Texture)