FOURTH LAB REPORT : IMPATIENS BALSAMINA
SOIL SALINITY TEST: ELECTRIC CONDUCTIVITY TEST
ENVIRONMENTAL SCIENCE (HS11)
SS11403 ENVIRONMENTAL SOIL SCIENCE
YEAR ONE SEMESTER 2 2017/2018
LECTURER: MDM. DIANA DEMIYAH
NAME
|
MATRIC NUMBER
|
CHAN CHU YIN
|
BS17110446
|
CHOW YIAN PENG
|
BS17110592
|
DARREN NETANIEL ERIC ROGERS
|
BS17110402
|
MIMORI SOGA
|
BS17270765
|
NUR AISYIKIN BINTI ABDULLAH
|
BS17160683
|
NUR DINIE DAYANA BINTI MOHAMAD
RAFI
|
BS17110064
|
INTRODUCTION
What is soil salinity all about? This term is broadly used to show or describe the content of the salt in the soil. Salt usually known originated from the sea as it salt’s content in it is high, but where the salt in the soil came from? Salt is a naturally occurring mineral within soil and water that affects the growth and vitality of plants. Although some salt is a necessity for plant growth, too much salt will result in a plant that suffers from dehydration, yield decline, or death. This salinity of soil can be affected by some factors influenced by the human activities; their daily activities. When the salt content becomes high, the soil becomes sodic soil and not very good for growth and crop production.
Salinization is the
process when water-soluble salts accumulate and increase of its content in the
soil. This process can make impacts on environmental health, agricultural
production and economics.
In primary stages, the salinity affects the metabolism of soil
organisms and reduces the soil productivity, then a more dangerous impact occurs
when this process continues; destroying all vegetation and the living organisms
living in the soil. When planting in soil that may have a high saline
content, it is important to know the salinity tolerance of individual crops.
There are some
experiments is conducted to measure the soil salinity. Soil salinity is tested
by measure its electrical conductivity (EC). The salt is extracted by using two
methods; filtration with ratio and by using the vacuum pump. Then, the water
extracted from the soil is measured by using conductivity meter and its probe.
AIM
The aim of this experiment is finding the best soil that can planted the plant due to the high content of salt within the soil.
The aim of this experiment is finding the best soil that can planted the plant due to the high content of salt within the soil.
OBJECTIVES
1. To investigate
the salinity status of the soil
2. To determine
the characteristics of soil
3. To determine
the electric conductivity of each soil
MATERIALS
AND APPARATUS
- 5 types of air dried soil samples (Sand soil from
ODEC, mangrove soil, FSSA lake soil, black soil, soil from Tanah Bukit)
- Less than 2mm mesh size sieve (we used 1mm one)
- 200ml glass beaker
- Spatula
- Distilled water
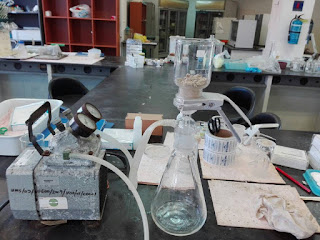
- Vacuum pump
- Laboratory flask
- Graduated cylinder
- Size 42 Whatman filter paper
- Bottle container
- Electric conductivity meter
PROCEDURES
- Air dried soil samples for Tanah
Bukit that have less than 2mm size is prepared.
- 2mm mesh size sieve is used
manually.
- Soil samples of Tanah Bukit are
checked to make sure there are no contain of roots, bark and stones.
- Distilled water is used to make a
saturated paste for each of our 100g of air dried soil sample of Tanah
Bukit.
- Distilled water is used again to
make a combination of 25g of Tanah Bukit and water with another Tanah
Bukit with ratio 1:1, 1:2, and 1:5.
- The mixer is stir for 10 minutes.
Vacuum Pump
- 42 Whatman filter paper is put
first on the funnel before the saturated plate is put.
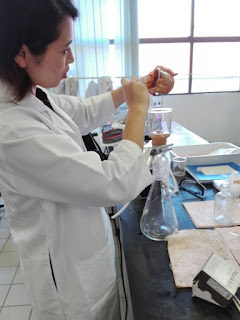
- The water is extracted using the
vacuum pump.
- The filtrate in a bottle container
with label is kept.
- The electrical conductivity is
measured.
- The probe with distilled water is
rinsed every time we measured using different soil samples.
RESULTS
Ratio 1:1
Soils
|
Conductivity (µS)
|
Average
|
Temperature
(℃)
|
Average
|
Volume (mL)
|
||||
Black soil
|
1736.0
|
1698.0
|
1696.0
|
1710.0
|
24.1
|
24.1
|
24.1
|
24.1
|
25.0
|
Mangrove
|
12310.0
|
11760.0
|
11820.0
|
11963.3
|
23.3
|
23.5
|
23.6
|
23.5
|
25.0
|
Hills soil
|
33.5
|
24.8
|
27.4
|
28.6
|
23.6
|
23.9
|
23.8
|
23.8
|
25.0
|
Fssa soil
|
89.4
|
79.7
|
90.7
|
86.6
|
22.7
|
22.8
|
22.7
|
22.7
|
25.0
|
Odec soil
|
88.6
|
87.1
|
87.8
|
87.8
|
23.2
|
23.4
|
23.6
|
23.4
|
25.0
|
Table 1: Electrical conductivity of 5 different type of soils on 1:1 ratio
Ratio 1:2
Soils
|
Conductivity
(µS)
|
Average
|
Temperature
(℃)
|
Average
|
Volume
(mL)
|
||||
Black soil
|
1775.0
|
1732.0
|
1784.0
|
1763.7
|
23.2
|
23.3
|
23.2
|
23.2
|
50.0
|
Mangrove
|
13920.0
|
13750.0
|
13930.0
|
13866.7
|
23.3
|
23.3
|
23.3
|
23.3
|
50.0
|
Hills soil
|
18.2
|
17.9
|
17.8
|
17.9
|
23.0
|
23.0
|
23.1
|
23.0
|
50.0
|
Fssa soil
|
60.3
|
61.7
|
59.9
|
60.6
|
22.7
|
22.7
|
22.8
|
22.7
|
50.0
|
Odec soil
|
116.7
|
117.0
|
117.2
|
117.0
|
23.4
|
23.4
|
23.1
|
23.3
|
50.0
|
Table 2: Electrical conductivity of 5 different type of soils on 1:2 ratio
Ratio 1:5
Soils
|
Conductivity(µS)
|
Average
|
Temperature
(℃)
|
Average
|
Volume (mL)
|
||||
Black soil
|
804.0
|
816.0
|
816.0
|
812.0
|
22.9
|
22.7
|
22.7
|
22.8
|
125.0
|
Mangrove
|
6570.0
|
6570.0
|
6580.0
|
6573.3
|
23.0
|
22.9
|
22.9
|
22.9
|
125.0
|
Hills soil
|
23.1
|
23.5
|
23.3
|
23.3
|
23.1
|
23.1
|
23.2
|
23.1
|
125.0
|
Fssa soil
|
62.6
|
63.4
|
61.3
|
62.4
|
22.6
|
22.6
|
22.6
|
22.6
|
125.0
|
Odec soil
|
103.4
|
104.0
|
104.2
|
103.9
|
23.4
|
23.1
|
23.3
|
23.3
|
125.0
|
Table 3: Electrical conductivity of 5 different type of soils on 1:5 ratio
Vacuum pump
Soils
|
Conductivity (µS)
|
Average
|
Temperature (℃)
|
Average
|
||||
Black soil
|
1261.0
|
1259.0
|
1261.0
|
1260.3
|
21.2
|
22.3
|
22.3
|
21.9
|
Mangrove
|
4510.0
|
4420.0
|
4420.0
|
4450.0
|
23.5
|
24.1
|
24.4
|
24.0
|
Hills soil
|
241.0
|
243.0
|
241.0
|
241.7
|
22.2
|
22.0
|
21.8
|
22.0
|
Fssa soil
|
314.0
|
347.0
|
336.0
|
332.3
|
22.7
|
22.8
|
22.8
|
22.8
|
Odec soil
|
450.0
|
445.0
|
446.0
|
447.0
|
21.3
|
21.4
|
21.5
|
21.4
|
Table 4: Electrical conductivity from 100g of 5 different type of soils after
vacuum pumped
DISCUSSION
According to the results, black soil has the
highest electrical conductivity (EC) followed by mangrove soil, ODEC soil, FSSA
lake soil and last the hill soil (tanah bukit) achieved the lowest EC reading
in combination of 1:1 ratio of water with soil sample. For 1:2 and 1:5 ratio of
water and soil sample combination filter test, mangrove soil has the highest EC
reading while the lowest EC soil remain the same, hill soil. Apart of that, the
EC reading for the filtered water from vacuum pump also obtained the same
results, which mangroves soil obtained the highest reading and the hill soil
has the lowest EC reading. The electrical conductivity of water is a measure of
salinity. EC of water estimates the total amount of solids dissolved in the
water (Guy, 2013). The higher the EC reading, the higher the contents of
saturated mineral, the higher the salinity. Hence, we can conclude that
Mangroves is very saline which contained many of saturated mineral. While for
the hill soil is non-saline which having the lowest EC reading. Too much of
salts will suffer the plant growth so mangrove soil is not suitable to all
types of plant. In contrast, hill soil also not suitable to plant growth as it
does not contain much nutrient to the plant. Black soil, ODEC soil and FSSA
lake soil may more suitable to plant growth because the salinity of the soil is
in average.
CONCLUSION
The electrical conductivity analysis is conducted in order to measure the amount of salt in the soil. The electrical conductivity is correlated with dissolved ions. The more ions are dissolved in the soil or water, the higher the electrical conductivity is.
Based on the soil texture
and the electrical conductivity analysis, the salinity of soil is determined.
Mangrove soil is very saline. Black soil is slightly saline. Soil from FSSA
lake, sand soil from ODEC, and soil from Tanah Bukit are non-saline. In terms
of salinity, plants are able to grow in the black soil, FSSA lake soil, ODEC
soil, and Tanah Bukit soil. However, most of plants cannot grow properly under
the very saline condition. Some specific plants like mangrove trees are
tolerant with high salinity soil.
REFERENCES
Monica Z. Bruckner (2018, February 14). Water
and Soil Characterization - pH and Electrical Conductivity. Retrieved April 27,
2018, from https://serc.carleton.edu/microbelife/research_methods/environ_sampling/pH_EC.html
Sela, G. (2013, December 01). Evaluating the
Electrical Conductivity of Water. Retrieved April 27, 2018, from https://www.maximumyield.com/evaluating-the-electrical-conductivity-of-water/2/2534
Soil Salinity (2018). Maximum Yield – for Growing Professionals. Retrieved from https://www.maximumyield.com/definition/1895/soil-salinity
APPENDICES
Figure
1: Mangrove’s
soils are filtered according to the ratio of 1:1, 1:2 and 1:5
Figure
2: A paste
is poured into the funnel before the water in the paste is vacuumed out
Figure
3: A set of
vacuum pumps
Figure
4: Residue
left after the water is vacuumed out


Mangorve highest, second black soil?
ReplyDelete